One of the most important KPIs you should be tracking in your practice is the “net change in active patients” metric. It is a performance measurement that is not readily available in your practice management software, yet it is arguably one of the most insightful.
It’s not the easiest number to calculate, but once you know what your number is, you will have a crystal-clear understanding of whether your practice is truly growing. It goes without saying that serving a growing base of clients really helps to alleviate some of the other pressures of managing your business.
What is an “active patient”?
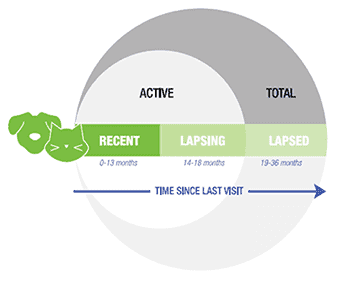
At VetSuccess, we define active patients as those that have had any transaction in the practice in the last 18 months. Why 18 months? Because we believe that these patients are dedicated to your practice and are active contributors to your revenue. Not every pet owner brings their pet in within 12 months each year. Life gets busy, people get behind. We need to give them a buffer. After a patient hasn’t been into your practice for 18 months, we consider them to be lapsed. At that point, the data tells us that there is less of a chance that the client will come back to you unless it is an emergency.
What is “net change in active patients”?
Think of your active patient count like your bank balance. At the beginning of the month you have some amount of money in the bank. Money comes in, and money goes out. At the end of the month, you have a new balance in your account. When the money you have in your account at the end of the month is greater than the money you had at the beginning of the month, you’ve grown your account balance and have a positive cash flow.
Similarly, with active patients, you may (hopefully) gain new patients each month but you’ll also lose some when clients move, decide to see another veterinarian, or a patient passes away. If you are running at a deficit and losing more patients than you are gaining, you are losing opportunities. More importantly, if that deficit continues for several months, your practice may be shrinking.
How to calculate your “active patient count”
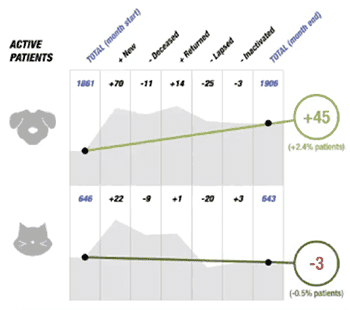
Start with the number of active patients from the previous month, then add in patients that are new to the practice for that month.Here’s how you manually calculate the number:
- Subtract deceased patients, as well as patients that you inactivated that month.
- Add in returned patients (those that hadn’t been in to the practice for 19-36 months but returned to you).
- Subtract lapsed patients (those that haven’t been in to the practice in more than 18 months).
As I said, the active patient count isn’t the easiest number to calculate, but it’s an important KPI for your practice. After all the additions and subtractions have been completed, you’ll have the total number of active patients at month’s end.
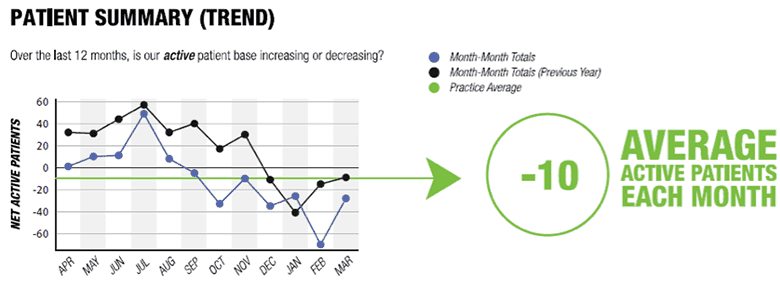
If you compare that against the total from the previous month, you’ll have your net change in active patients for that month. More importantly, you can look at that number for each of the last 24 months to see how you are performing over time and determine your average for the year (refer to Patient Summary Trend graph). The goal is to consistently be above 0 each month to ensure that your practice is growing for the year.
Why can’t we just use revenue as an indicator of practice growth?
Increasing revenue year over year is in important indicator of the health of your practice. However, if that is all you are tracking, how will you know if you are seeing more patients and providing more care? An increase in revenue can simply be the result of a price increase. If your goal for your practice is to grow, meaning to provide more care to more patients, simply tracking revenue alone is misleading. You need to understand how many patients you are caring for regularly.
Let’s dig deeper into two examples from SCVMA practices
Example 2:
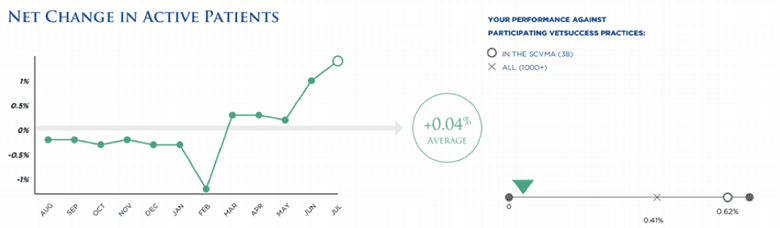
VetSuccess provides monthly benchmarking reports to SCVMA practices, and I’ll use a couple of examples to illustrate the value of the net change in active patients metric. In the first example, we see a practice with an average net change in active patients of .04%. By all accounts, their patient growth is flat. What’s interesting about this example is that their growth in active patients didn’t start until March of 2018. For seven of the previous twelve months, this practice was losing patients. What changed in March? Had they not been sending out reminders? Did they have staff changes or potentially lose a doctor? The one thing about numbers is, they tell us what is happening, not necessarily why it’s happening. But now that this practice is aware of what’s going on, they can investigate the specifics and address the trend.
There are several factors that can contribute to a change in active patients and not all are related to the quality of service or care you provide. Did you lose a long-term receptionist? Have you increased or decreased your marketing efforts? Did you recently clean up your practice management software and inactivate a significant number of patients? Is there seasonality in your practice?
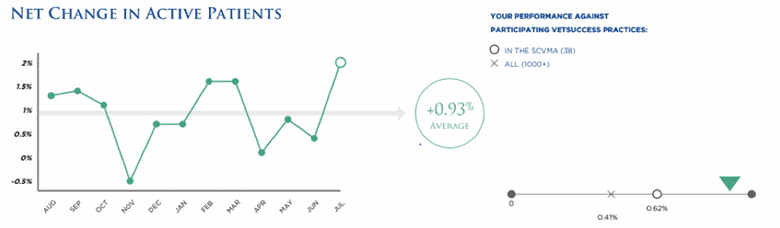
In our second example, we see a practice that is increasing their patient base an average of .93%. There are some fluctuations each month, yet over the past 12 months, they have grown an average of roughly 1%. If this practice has 3,000 active patients, that means that they are now seeing about 380 more patients than they were a year ago.
[bctt tweet=”Benchmarking your practice to others will put your performance in context and help you to set realistic goals and objectives, but the most important trendline to keep your eye on is your own. Are you doing better or worse than last year?”]
I’m guessing that your next question is, is that good? In our first example, the practice is below both the national and SCVMA averages (green arrow). In the second example, the practice is above both the national and SCVMA pace. While comparing your practice to others will put context around the metrics and help you to set realistic expectations, it is even more important to look at how your practice is performing over time. Are you doing better than you were last year? Than you were 6 months ago? The most important trendline to stay on top of is your own.
Ensure your practice’s continued good health and value
The Net Change in Active Patients visualization in the SCVMA Benchmarks report shows if the number of patients that the practice actively cares for is growing or shrinking and allows the practice to stay ahead of any trends. The “why” behind the number will be unique for each practice.
Think of it in the same way as you would when looking at lab results. If everything is within normal limits, you can sleep better at night knowing that your practice is healthy. You’ll need to keep your eye on any values that are starting to trend toward the outside of the range, but for right now, you’re healthy. If you see a value that is outside of normal limits, you’ll need to do additional investigating to understand why and determine a course of treatment. By keeping a close eye on the numbers, you can identify necessary changes early on and can implement a treatment plan that ensures your practice’s longevity.
Sheri Gilmartin, CVT is VP of Sales and Marketing for VetSuccess.