Do you use process flowcharts in your practice? If not, this one’s for you!
If your practice is anything like mine, you may, like me, sometimes experience a sense of foreboding that things are getting more complicated every day. To remain competitive, we’re increasingly focused on things like: developing more sophisticated marketing initiatives; sharpening our internal processes and procedures to a razor’s edge; diving deeper than ever into KPIs and metrics; creating new revenue opportunities; analyzing our community’s demographic data; and going to ever-greater lengths to understand what our clients want.
All of these are good things. Important things. In fact, they may be the very things that ensure we continue to prosper in the coming years. But, they’re also extra things, piled on top of an already gigantic mountain of the mission-critical systems and processes that form the foundation of our daily operations. More than ever, there are so many ways for things to slips through the cracks.
One way to prevent slippage: use process flowcharts
Think about it. Nothing in your practice is simple. Even something as straightforward as a wellness exam has a tremendous amount of moving parts. From when a client calls to schedule their pet’s appointment, until well after the appointment is finished and they’ve headed home, there are numerous opportunities for success and failure from a client-service perspective. Before we can tackle all of the new initiatives that look so promising on the horizon, it’s critical that our team is able to consistently nail our day-to-day processes — especially when it comes to client service.
While there are innumerable ways you can help ensure your team provides excellent service, today I’d like to focus on just one of them: process flowcharting.
What are flowcharts?
Before we explore how to use process flowcharts, let me explain what they actually are. Simply stated, flowcharts provide graphical representations of how work gets done at your practice. Each chart has one starting point, followed by a series of connected steps with lines and arrows indicating relationships and progressions. While many charts have a single endpoint, others have more than one, depending on the type of process being mapped. Flowcharts are usually organized chronologically from left-to-right or top-to-bottom. Different colors, icons, and shapes can be used to provide additional contextual information. (click image to enlarge)
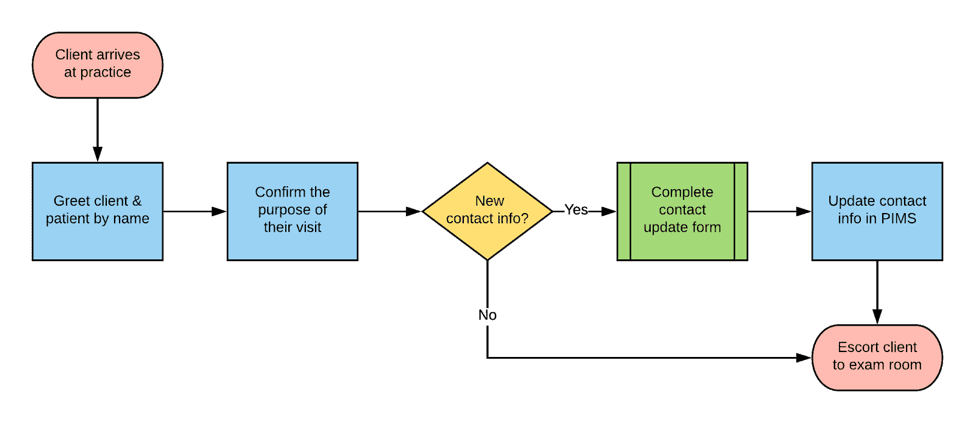
[bctt tweet=”When you use process flowcharts, you provide your team with a roadmap of how to successfully complete a process, and subsequently help ensure that clients receive a consistent experience from visit to visit.”] In addition to serving as day-to-day references for your experienced team members, they also act as quick-start guides for new hires.
There are many different styles of flowcharts, each with a different focus. Here are two of my favorites:
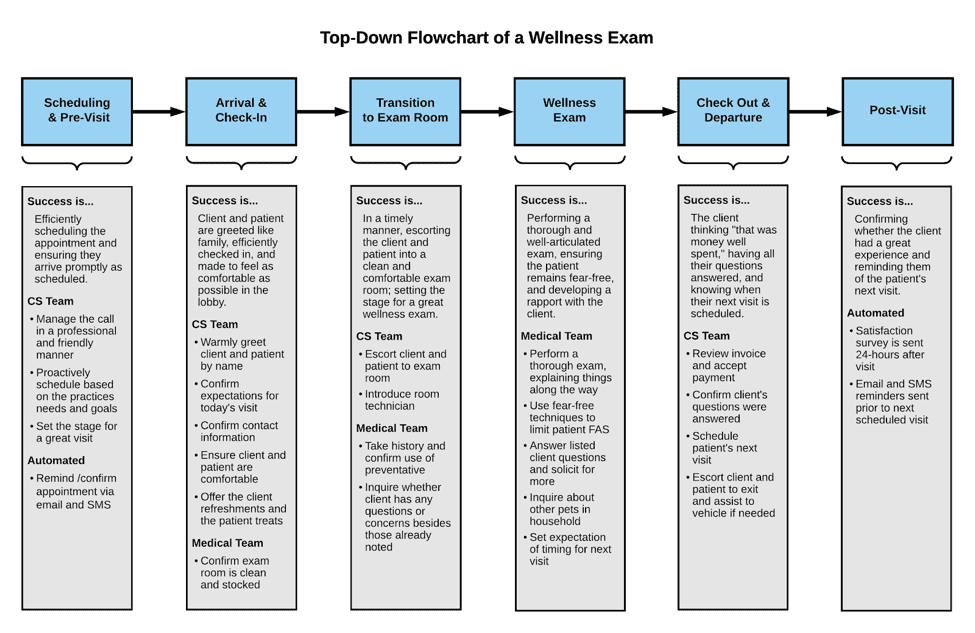
Top-down flowchart
The focus of a top-down flowchart is identifying the major steps of a process and providing detailed sub-actions each step along the way. The chart is designed with five or six major steps horizontally across the top, with departmental or role-specific sub-actions outlined beneath. If there’s room, I like to add “Success is…” sections that summarize the desired outcome for each of the major steps. The advantage of this style is the level of detail. The disadvantage is that it’s hard to include more than five or six major steps due to space constraints. (click image to enlarge)
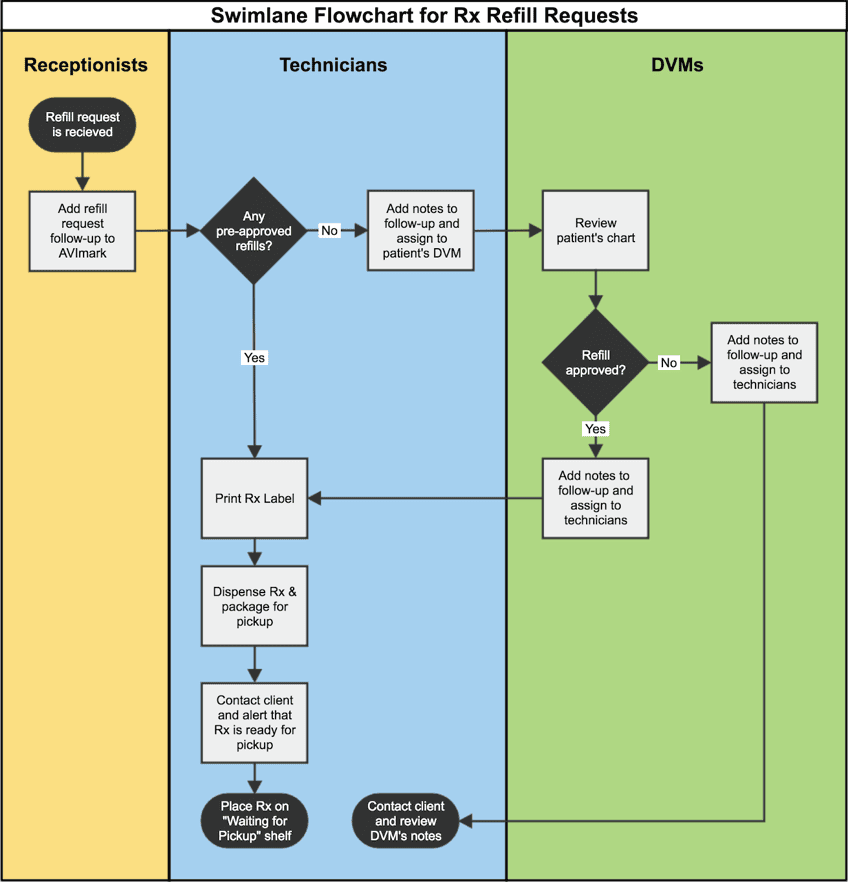
Swimlane flowchart
The focus of a swimlane flowchart is identifying who is responsible for each step of a process and how responsibility changes hands as the process is completed. The chart is divided horizontally by departments or functional roles. The process is mapped chronologically, step-by-step, starting at the top and working downwards, moving between the functional sections as warranted. The advantage of this style is that functional responsibility is clearly shown. The disadvantage is that the level of detail is somewhat limited. (click image to enlarge)
Best practices to help you use process flowcharts to your greatest advantage
The level of detail that should be included in any given flowchart will vary based on what you’re trying to communicate. If you plan to use process flowcharts to map out the big picture of a new client’s first visit to the practice, you’ll focus on the major steps. In contrast, if you intend to use process flowcharts to map out something more specific, like answering the phone and scheduling an appointment, you’ll take a deeper dive into the individual steps and sub-actions necessary to complete the task.
As a general rule, try to keep flowcharts small enough to fit on one page (or screen). Anything more substantial will be difficult to reference on an ongoing basis. You can always break down major steps further using separate, secondary flowcharts.
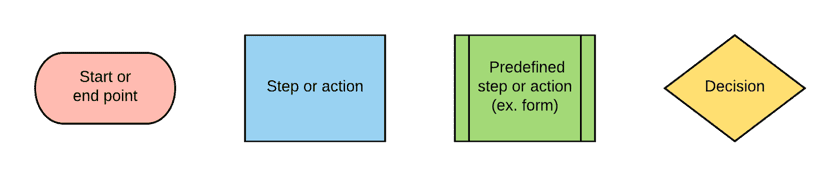
It’s also helpful to maintain consistency when it comes to shapes and colors. You can use any combination that you like, just keep them consistent throughout the entire flowchart. (click image to enlarge)
How to start using process flowcharts in 6 simple steps
- Select a process to flowchart. Start with something that frequently occurs at your practice; something that your team is already very familiar and comfortable with (we might as well make the first one easy, right?).
- Determine the level of detail that’s appropriate. Are you trying to communicate the big picture of a large process or show the detailed steps to complete a specific task?
- Determine the start and end point of the process. What triggers the process to begin, and what indicates its completion?
- Progressing forward from the start point, start adding all of the major steps and decisions necessary to complete the process. Use lines and arrows to indicate the progression of the steps.
- Depending on the style of chart you’ve selected and its intended use, fill in additional details and sub-steps between the major steps.
- Now, get a second opinion. What are you missing? How can the process be simplified? Get your team involved (see below).
Make it a team effort
[bctt tweet=”In my experience, the best process flowcharts aren’t created in a vacuum. Get your team involved! The more ownership they have, the more invested they’ll be in finding ways to improve the process.”] This is also an excellent opportunity to define what success looks like at your practice. As your team is flowcharting, make sure you’re discussing these type of questions:
- What are the specific questions we will always ask when someone calls to schedule an appointment?
- What do we want clients to experience when they first walk in our front door? How will they be greeted?
- What does a clean, comfortable, and well-stocked exam room look like?
- At checkout, if we always want to ask clients whether all of their questions have been answered, how should we phrase that question and what system can we put in place to ensure we always remember to ask?
- How can we proactively ask clients if we can assist them to their vehicle when they leave?
- How do we want clients to feel as they head home from our practice?
This process can be especially enlightening when multiple departments are involved. It helps to have multiple perspectives to troubleshoot solutions as points of friction or inefficiencies are identified. Your team, working together, will come up with some clever ways to improve things and work together more efficiently.
Flowcharting toolbox
When developing and fine-tuning flowcharts as a team, I find it very convenient to use sticky notes and an empty wall. The key is to write each step or sub-action on an individual note. This makes it easy to rearrange things as needed. It can also be helpful to use notes in a variety of sizes and colors for further differentiation.
Once you have finished arranging your flowchart, I recommend recreating it in a digital format. There are lots of flowcharting and mapping software available. Two of my favorites are Lucid Chart and Gliffy. Google Slides or Microsoft Powerpoint can also work in a pinch. Having an electronic version of your flowchart will make it easy to keep things updated as you make procedural improvements in the future. Another plus is that you can add URL hyperlinks to your digital charts and connect to other documents and resources.
On a final note, don’t be afraid to let your flowcharts flow!
Flowcharts are flexible. They’re made to be modified. Remember, they’re snapshots of the way things are currently done at your practice. Processes change, improvements and efficiencies are discovered, and your team has brilliant ideas! Your flowcharts must be updated to keep pace. Prioritize these updates, and you’ll have an evolving means to drive continuous improvement at your practice.
Speaking of which, if you want to improve the level of preventive care your practice offers, check out the Compliance Tracker — another great tool you can use to track where you’re at and uncover opportunities for improvement.
Ben Spinks, MBA, CVPM, SPHR is the Hospital Administrator at Tipp City Veterinary Hospital, Co-Founder at Veteos, and a veterinary practice consultant. He can be reached at [email protected] or on LinkedIn.